
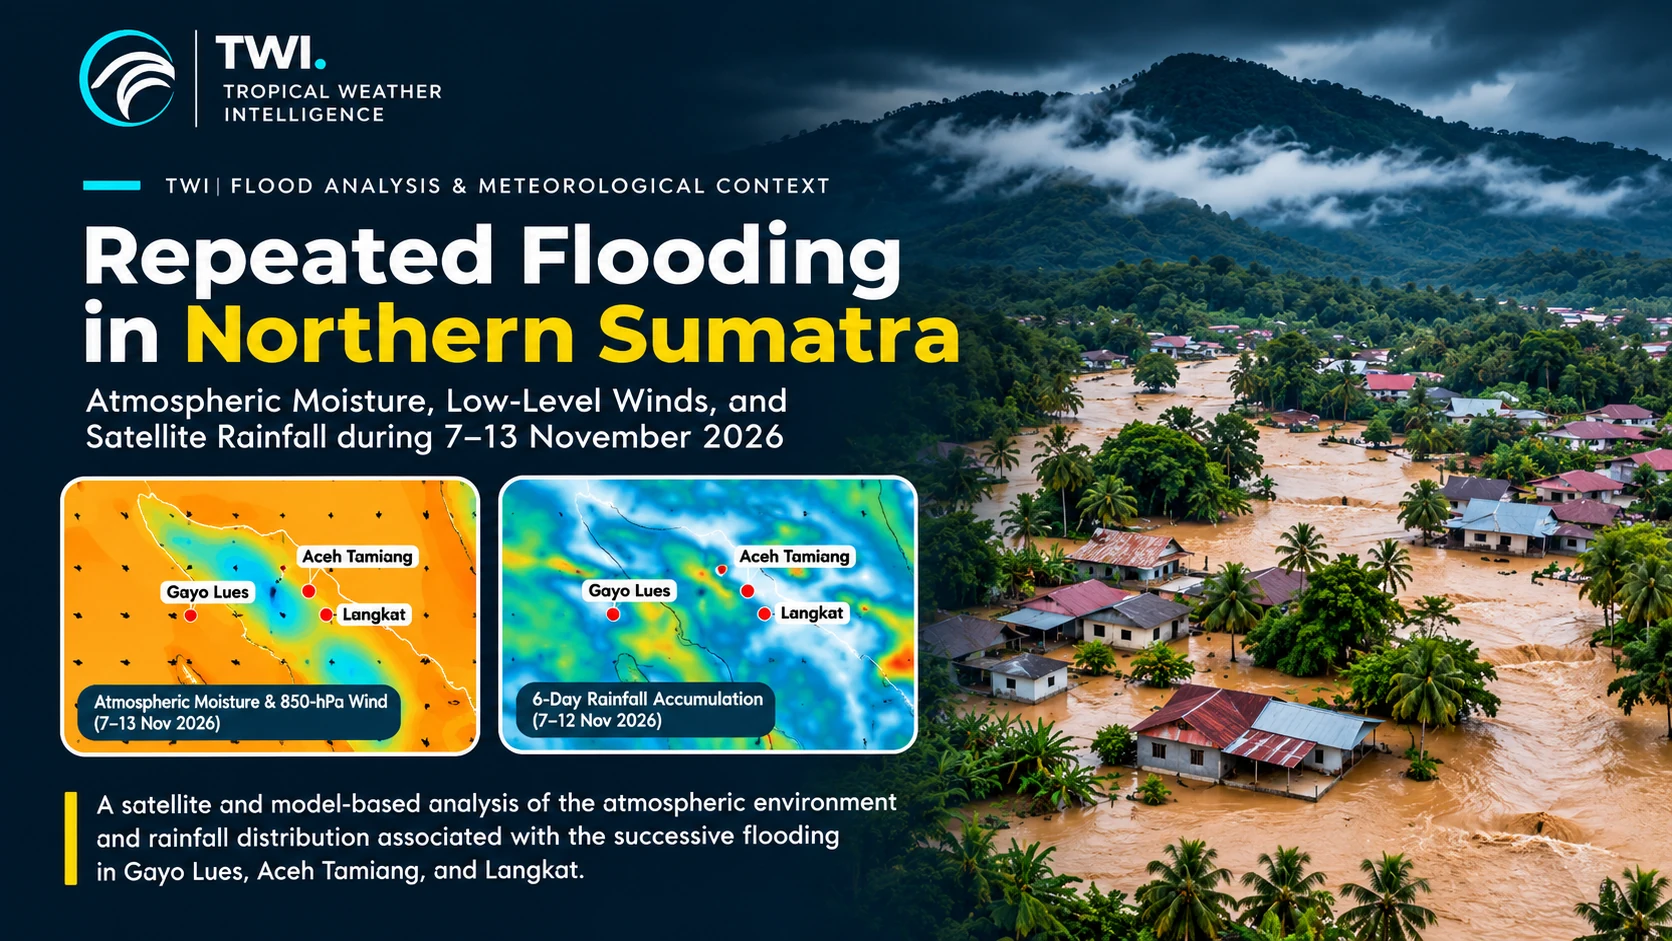
A succession of floods affected Gayo Lues, Aceh Tamiang and Langkat during 7–13 November 2026. Tropical Weather Intelligence (TWI) independently examines NOAA/NCEP GFS atmospheric analyses and NASA GPM IMERG satellite precipitation estimates to identify the moisture environment, low-level circulation and spatial rainfall distribution associated with these events. Together, these observations provide a scientifically grounded meteorological context for flood-risk assessment across northern Sumatra.
Three districts, successive flooding episodes
According to Indonesia's National Disaster Management Agency (BNPB), heavy rain from the afternoon of 7 November into the early hours of 8 November caused river overflow and flood-borne mud and timber in Gayo Lues, Aceh. BNPB identified impacts in Pertik and Ekan villages of Pining District and Badak village of Dabun Gelang District.
On 12 November, BNPB reported flooding in Perdamaian village, Kuala Simpang, Aceh Tamiang, after intense rain and overflowing drainage. Approximately 150 people were reported displaced and about 100 homes affected at the time of its report. On the same day, flooding in Sekoci village, Besitang, Langkat, followed several days of rain and rising river levels. BNPB reported approximately 835 households, or 3,155 people, affected, with 150 households temporarily displaced. These numbers are time-specific agency reports and may subsequently change.
Together, the official reports document several flooding episodes across northern Sumatra. Their meteorological conditions and local hydrological responses may differ from one district to another.
Figure 1 — Atmospheric moisture and low-level circulation
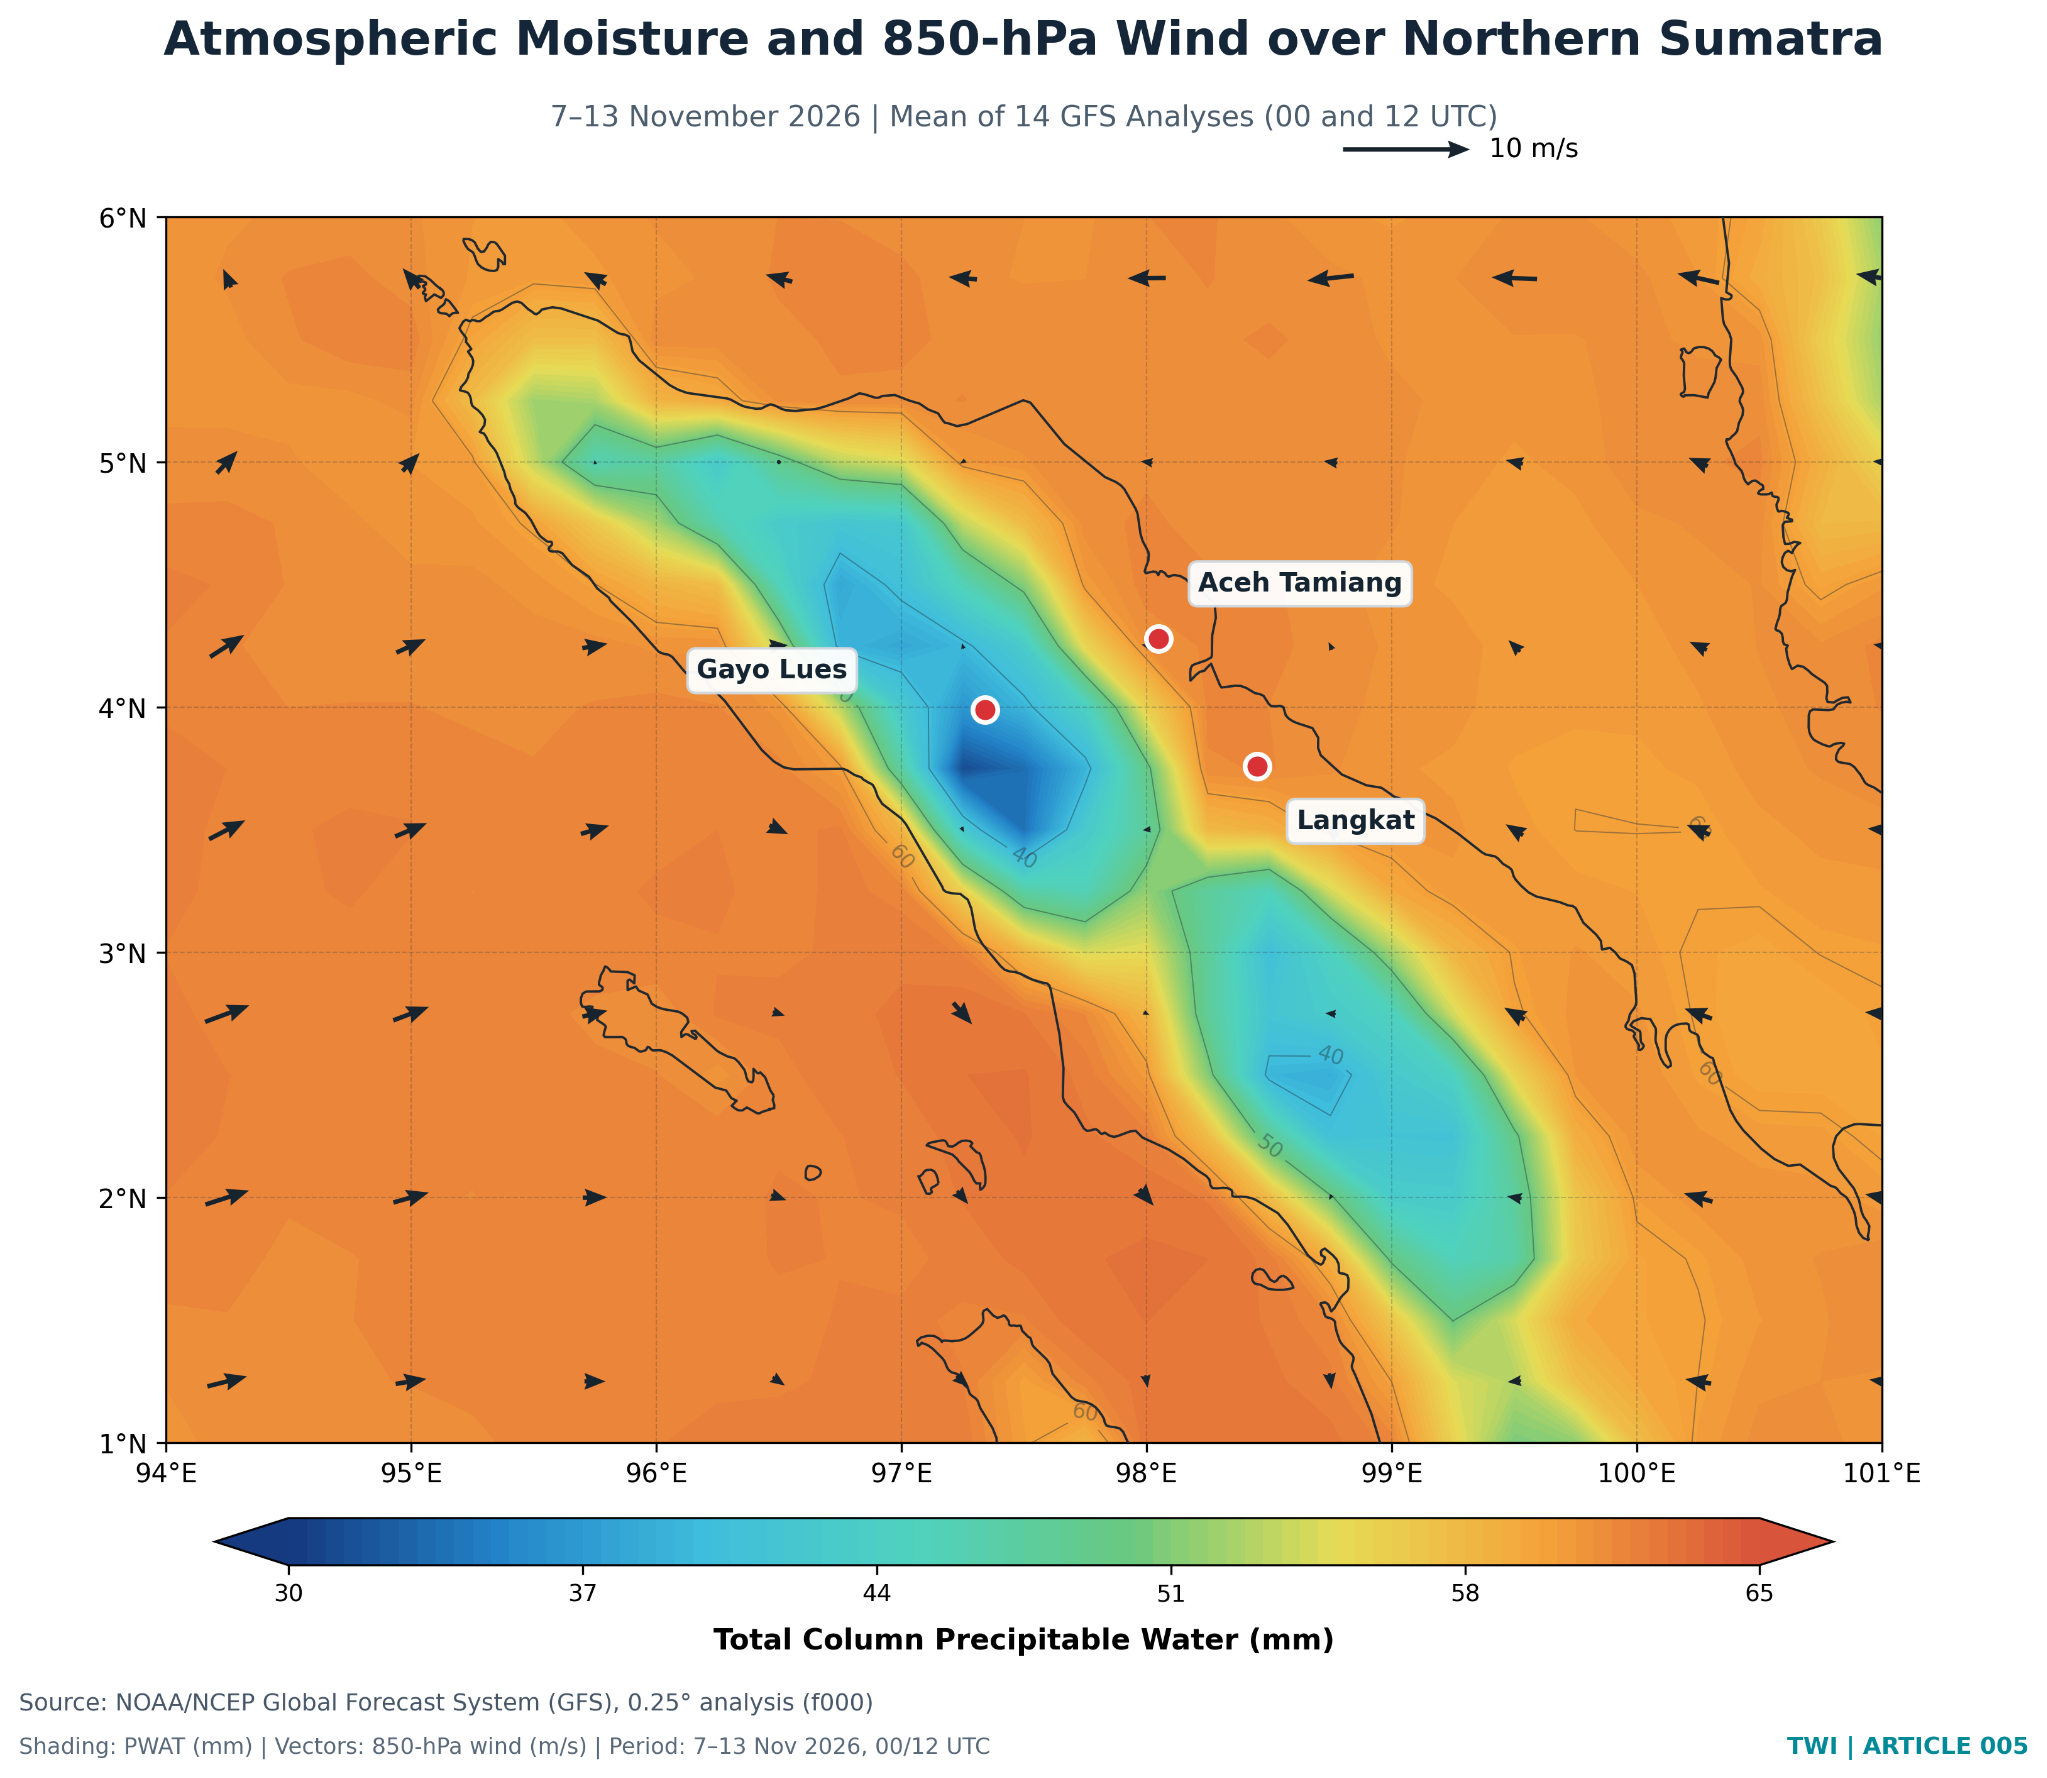
Figure 1 depicts a moist regional atmosphere, with higher column water-vapour amounts over surrounding waters and lower values along parts of the island's mountainous interior. This contrast should not be interpreted as evidence of reduced rainfall potential over the highlands: total-column water vapour is influenced by the thickness of the atmospheric column and underlying terrain.
Wind arrows at 850 hPa show the mean circulation over the seven-day period. Because averaging can conceal short-lived convergence and intense rain-producing episodes, the map cannot identify the exact trigger of a particular flood. Furthermore, 850 hPa can intersect elevated terrain over the Bukit Barisan range; wind values near or below model terrain should not be used to infer local surface airflow.
Figure 2 — Satellite-based rainfall accumulation
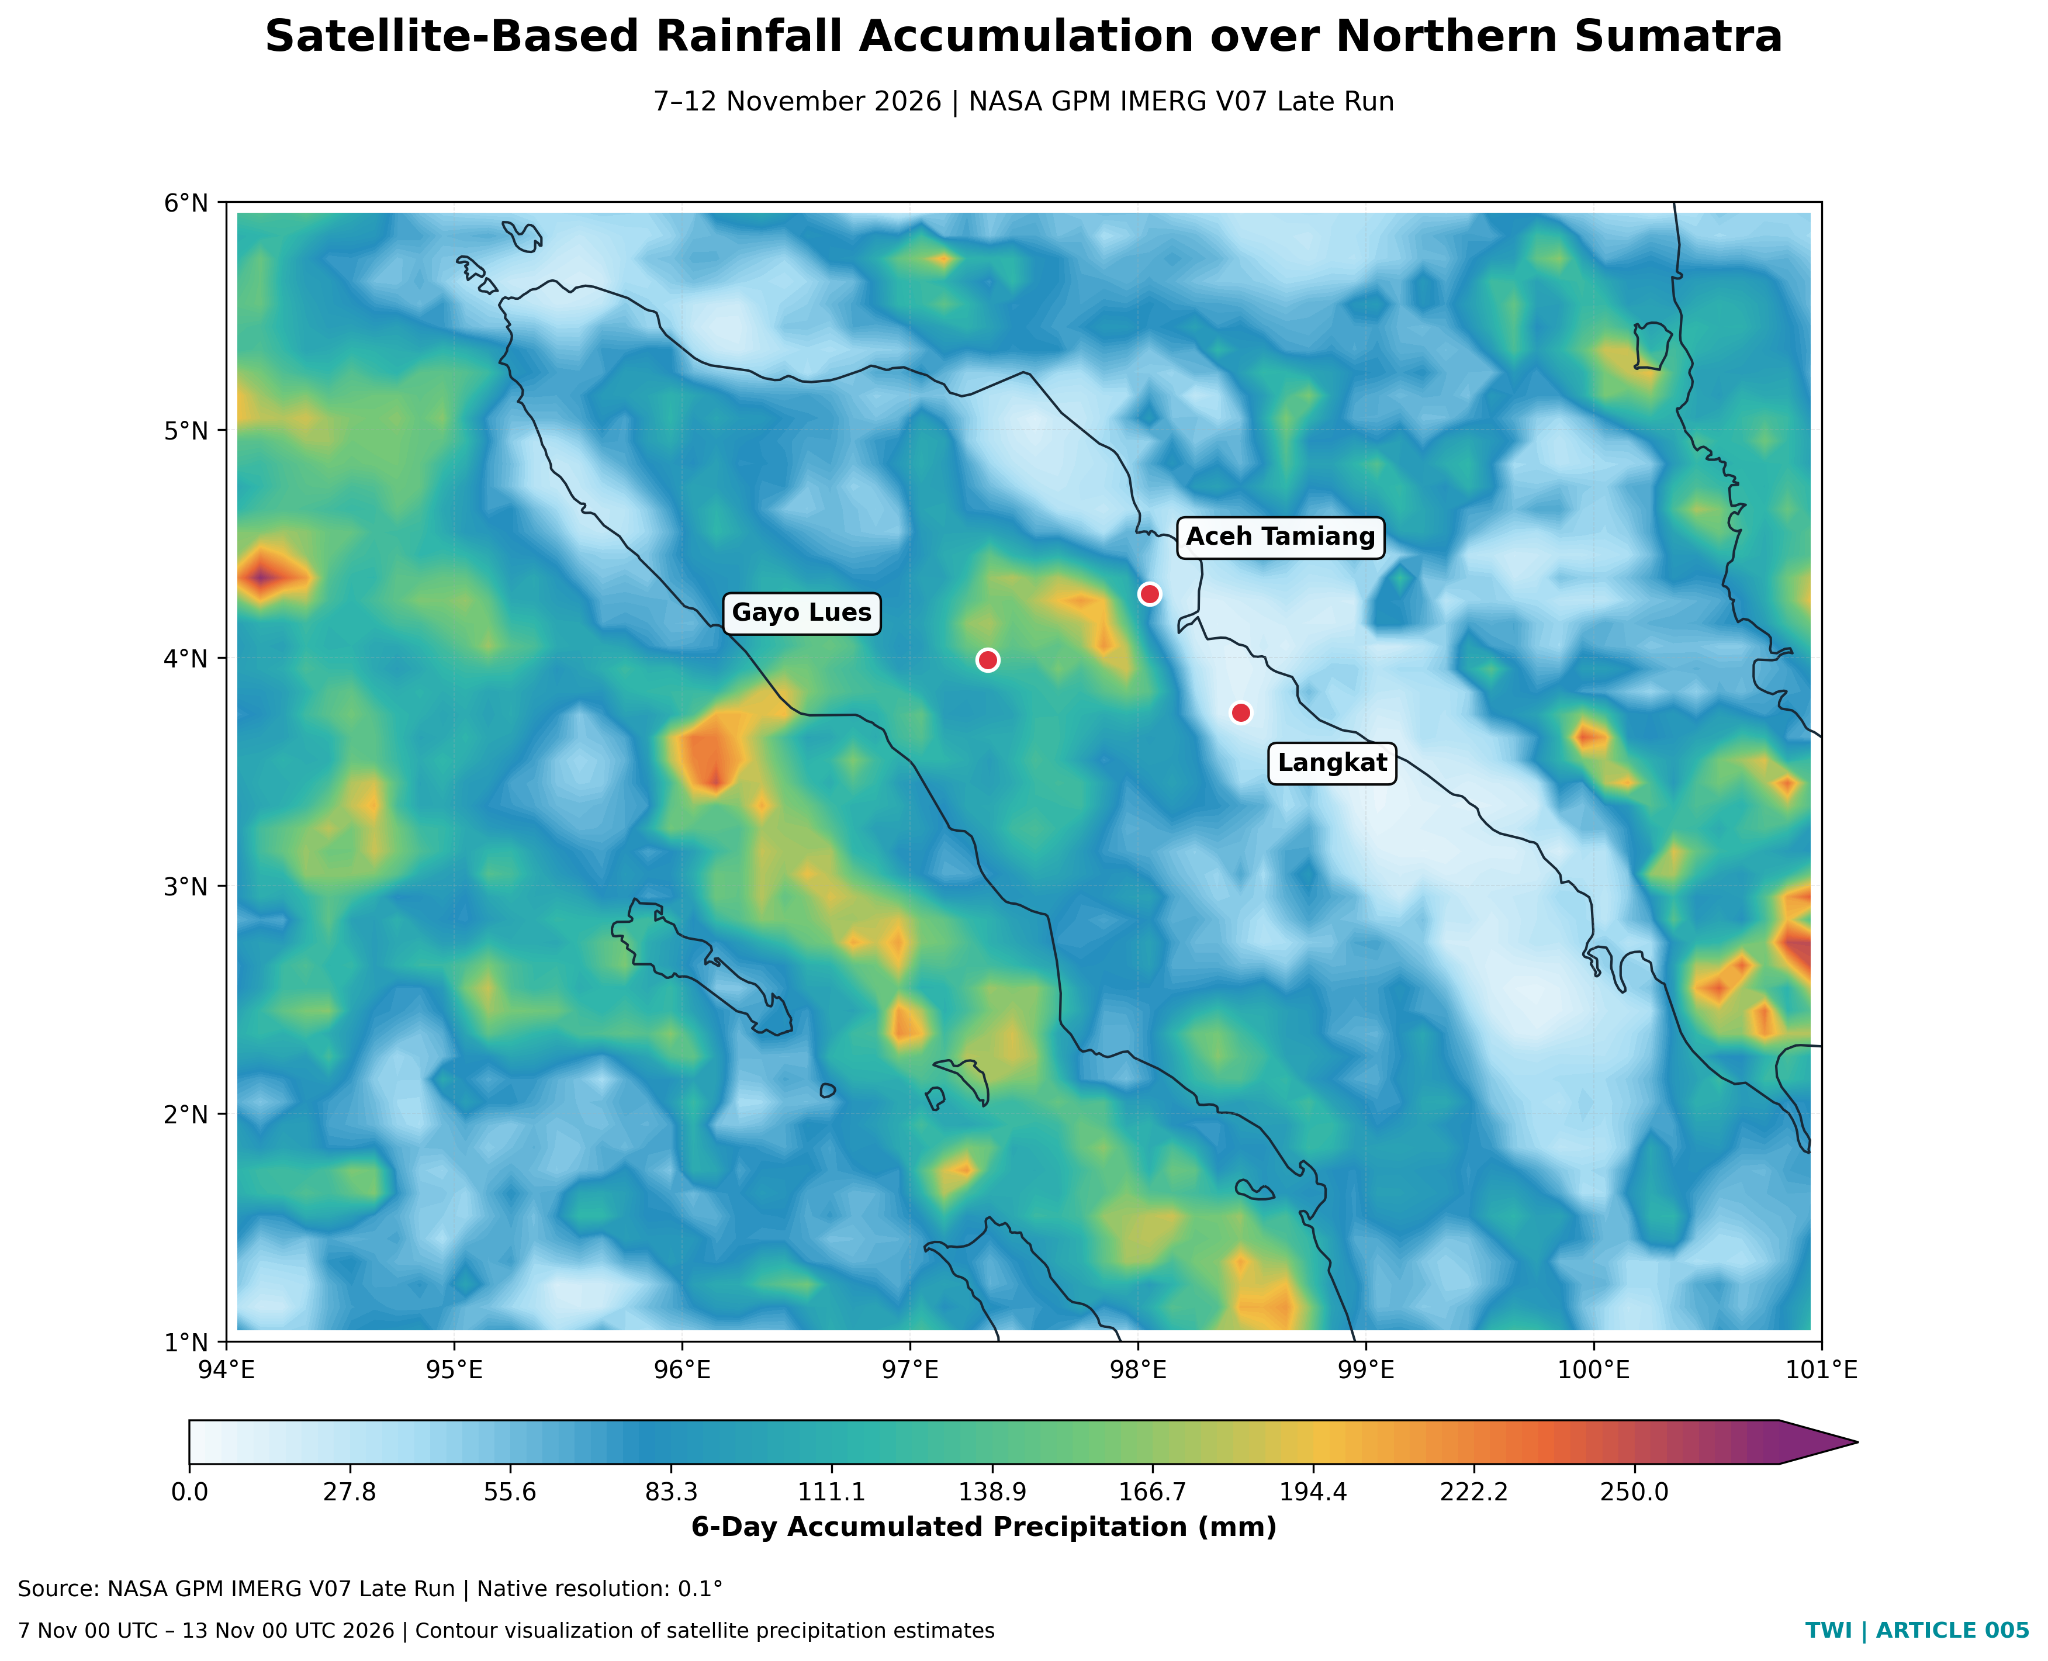
The IMERG map illustrates a heterogeneous rainfall distribution, including higher accumulations in some western and interior areas and comparatively lower totals in some eastern lowland locations. Rainfall maxima should not be interpreted as district-specific flood depths, nor can a dot on this map represent runoff across an entire drainage basin.
Notably, the rainfall accumulation ends on 12 November; therefore, it does not quantify rainfall on 13 November when subsequent flooding was reported in Aceh Tamiang. The 7–13 November GFS mean and 7–12 November IMERG total are intentionally labeled with different time windows and must not be treated as simultaneous, matched-period diagnostics.
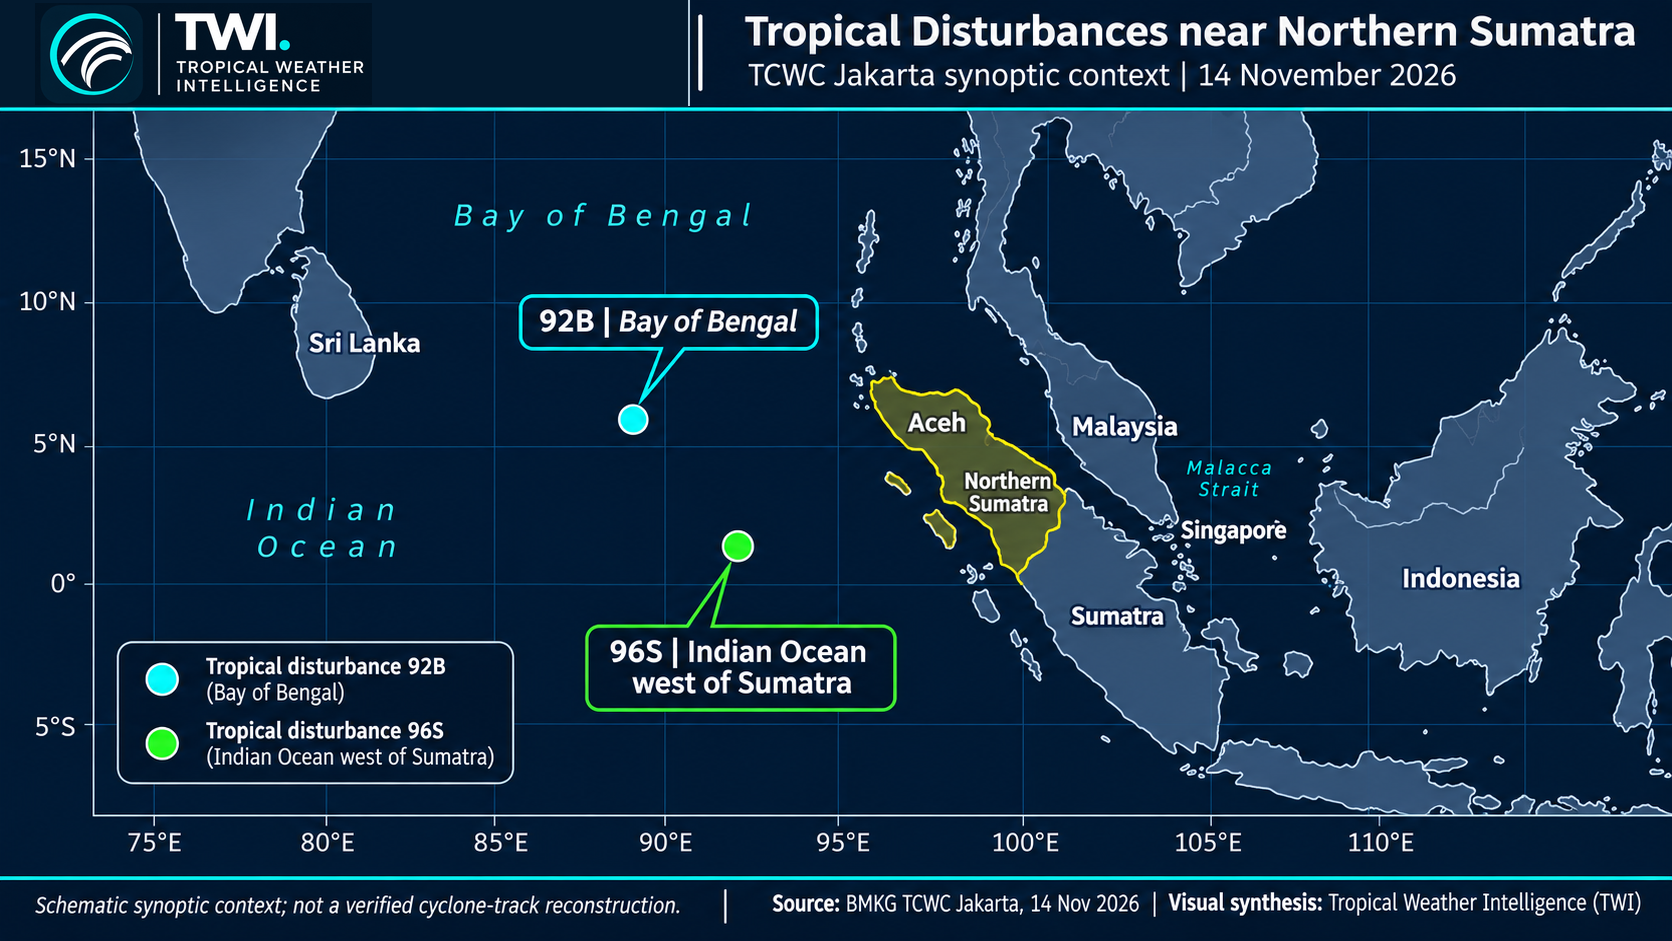
Their formation dates matter: the presence of these disturbances on 13–14 November should not be interpreted as proof that they caused flooding earlier on 7–12 November. The accompanying illustration depicts their broad geographic setting, not a reconstructed or forecast storm track.
BMKG TCWC Jakarta reported two tropical disturbances in the eastern Indian Ocean sector in mid-November 2026. Disturbance 92B developed over the Bay of Bengal on 12 November, while 96S formed over the Indian Ocean west of Sumatra on 13 November. The systems highlight an active regional synoptic environment during the final phase of the flood-reporting period and are relevant to continued monitoring of atmospheric circulation and moisture over Aceh and nearby waters.
Additional synoptic context — Tropical disturbances 92B and 96S
Why floods can occur away from rainfall maxima
Flooding depends not only on local rainfall totals but also on the timing and intensity of rain upstream, antecedent soil moisture, catchment configuration, river capacity, sediment and debris loads, drainage condition, and human exposure. Steep catchments in northern Sumatra may respond quickly to intense rainfall, while low-lying communities may flood because of upstream runoff or drainage limitations.
These mechanisms are physically plausible considerations, not conclusions demonstrated by the two maps. Establishing event-level causation would require time-resolved rainfall, terrain and watershed delineation, streamflow or water-level measurements, and incident-specific field information.
Implications for early warning
The November 2026 events highlight the value of a multi-source warning approach: satellite rainfall monitoring, weather forecasts, river and drainage observations, and local disaster reports. PWAT indicates available atmospheric moisture, but it is not a direct measure of precipitation, moisture-flux convergence, or flood severity. IMERG estimates precipitation over broad areas, but it can have uncertainties over complex terrain and during rapidly evolving convection.
For operational preparedness, agencies and communities should pay particular attention to repeated rainfall episodes across upstream catchments, not just the total rainfall measured near populated downstream areas.
Conclusion
Verified disaster reports establish successive flooding episodes in Gayo Lues, Aceh Tamiang and Langkat during 7–13 November 2026. GFS analyses show the regional atmospheric moisture and mean low-level circulation; IMERG depicts a spatially uneven six-day rainfall accumulation. Together, they provide valuable meteorological context but do not prove a single shared cause of flooding or quantify rainfall for every day of the event sequence.
The scientific priority is therefore integrated monitoring of rainfall evolution, watershed response and community exposure, with transparent acknowledgment of the resolution, time coverage and limitations of each dataset.
Meteorological data and independent TWI analysis
Flood event verification
Data and methodology. Figure 1 is a 7–13 November NOAA/NCEP GFS analysis of PWAT and 850-hPa winds (0.25°). Figure 2 is 7–12 November NASA GPM IMERG Late Run estimated precipitation (0.1°). Figure 3 summarizes the 14 November BMKG TCWC Jakarta synoptic monitoring context. Analysis and visual presentation: TWI. Satellite precipitation is an estimate and has uncertainties, particularly over complex terrain.
Media attribution: Tropical Weather Intelligence (TWI). Scientific enquiries may reference this analysis with appropriate attribution.