
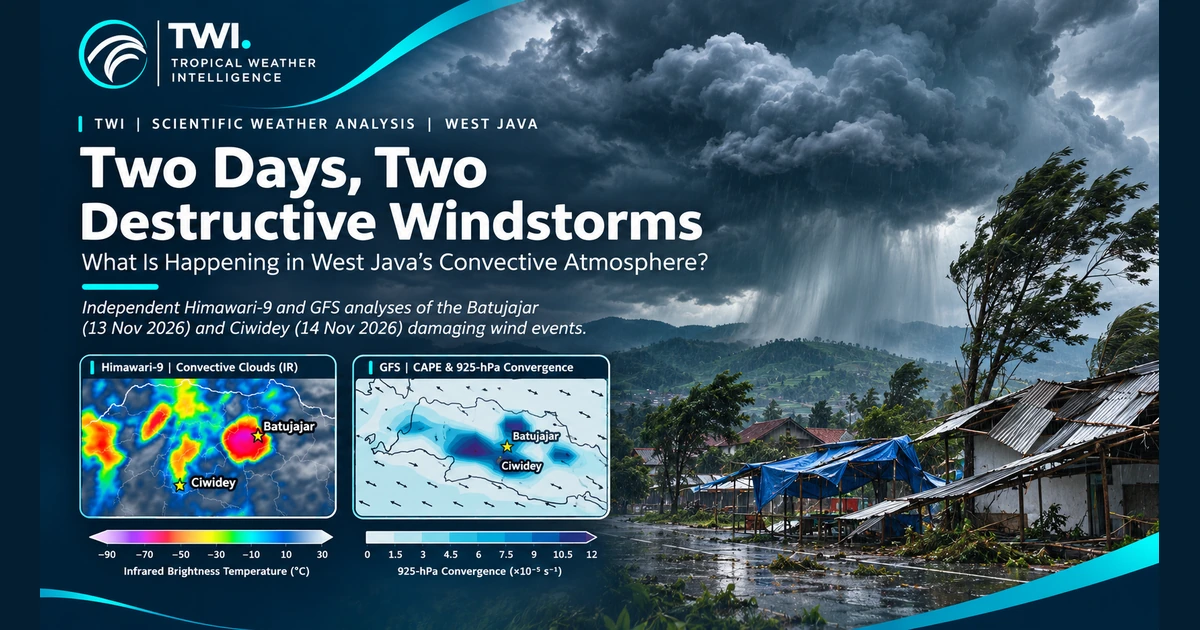
TWI editorial cover highlighting the Batujajar and Ciwidey wind events
Editorial illustration; Figures 1 and 2 below present the satellite and model-based scientific analyses.
TWI · SEVERE CONVECTIVE WEATHER ANALYSIS

Two Days, Two Destructive Windstorms: What Is Happening in West Java’s Convective Atmosphere?

Batujajar · 13 November | Ciwidey · 14 November 2026

Dr. Deni Septiadi · Founder & Scientific Director, TWI · 14 November 2026

Two afternoons, two destructive wind events

Two consecutive afternoons of destructive winds struck the Bandung region on 13–14 November 2026, highlighting the hazards associated with rapidly developing tropical convection in West Java.

On Friday, 13 November, heavy rainfall and strong winds affected Batujajar, West Bandung Regency, around 14:30 Western Indonesian Time (WIB). An updated local assessment reported 197 damaged houses: 82 slightly, 75 moderately and 40 severely damaged. Twelve public facilities and SDN Hegarmanah were also affected. Earlier reports mentioned three injuries.

The next afternoon, 14 November, damaging winds affected Ciwidey and neighbouring Pasirjambu in Bandung Regency. At Cibeureum Market, reports described 25 damaged shops and buildings, two of them severely affected. Roofs, canopies and utility infrastructure were among the impacts; additional damage was reported nearby.

The events were approximately one day apart, but they must be assessed as separate convective episodes, not assumed to be associated with the same storm system. Tropical Weather Intelligence (TWI) compared observations from Himawari-9 and atmospheric analyses from NOAA/NCEP GFS.

Damage data sources. The preliminary figure of 197 damaged houses in Batujajar is attributed to the Batujajar District Administration. The figure of 25 damaged buildings in Ciwidey–Pasirjambu is attributed to the Bandung Regency Disaster Management Agency (BPBD Kabupaten Bandung). These figures are preliminary, may be revised, and do not represent TWI's own field survey.

1. Satellite evidence: contrasting convective development
Himawari-9 infrared comparisons for Batujajar on 13 November and Ciwidey on 14 November 2026
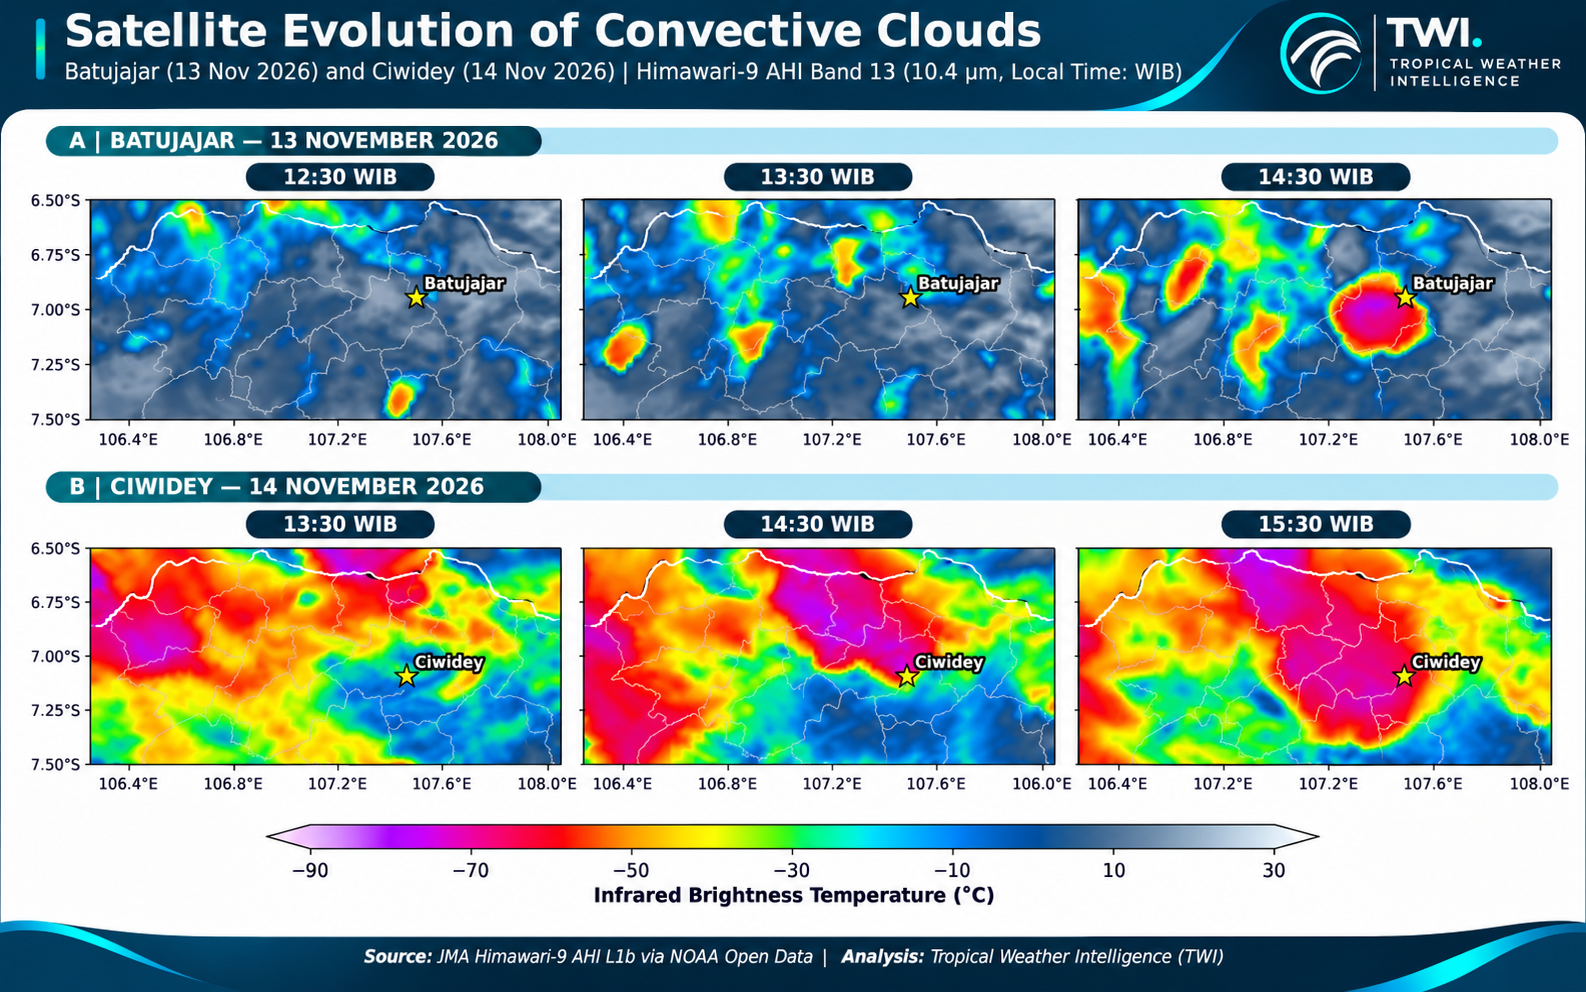
Figure 1. Himawari-9 AHI Band 13 (10.4 µm) enhanced infrared imagery. Batujajar: 12:30, 13:30 and 14:30 WIB, 13 November; Ciwidey: 13:30, 14:30 and 15:30 WIB, 14 November. A consistent brightness-temperature scale is used. The figure has an editorial presentation layer; numerical analysis must refer to calibrated source pixels. Source: JMA via NOAA Open Data; scientific processing: TWI.

For Batujajar, cold convective clouds were comparatively limited around the site at 12:30 WIB. By 14:30 WIB, a concentrated cluster of very cold cloud tops had developed close to the geographical reference point, around the reported period of destructive winds.

For Ciwidey, extensive cold cloud cover was already present by 13:30 WIB. Deep convective regions remained prominent through 14:30 and 15:30 WIB, suggesting a broader and more persistent convective environment than in the selected Batujajar sequence.

The enhanced infrared colours include areas in approximately the −70°C to −80°C brightness-temperature classes. Such temperatures are consistent with high, cold cloud tops associated with deep convection. They do not directly measure rainfall rate, updraft velocity or surface gust strength. An exact minimum temperature or the area colder than −70°C cannot be established from the published figure alone: those require calculations from the original geolocated pixels.

2. CAPE: instability is only part of the story
GFS CAPE and 925 hPa convergence and wind analysis for Batujajar and Ciwidey
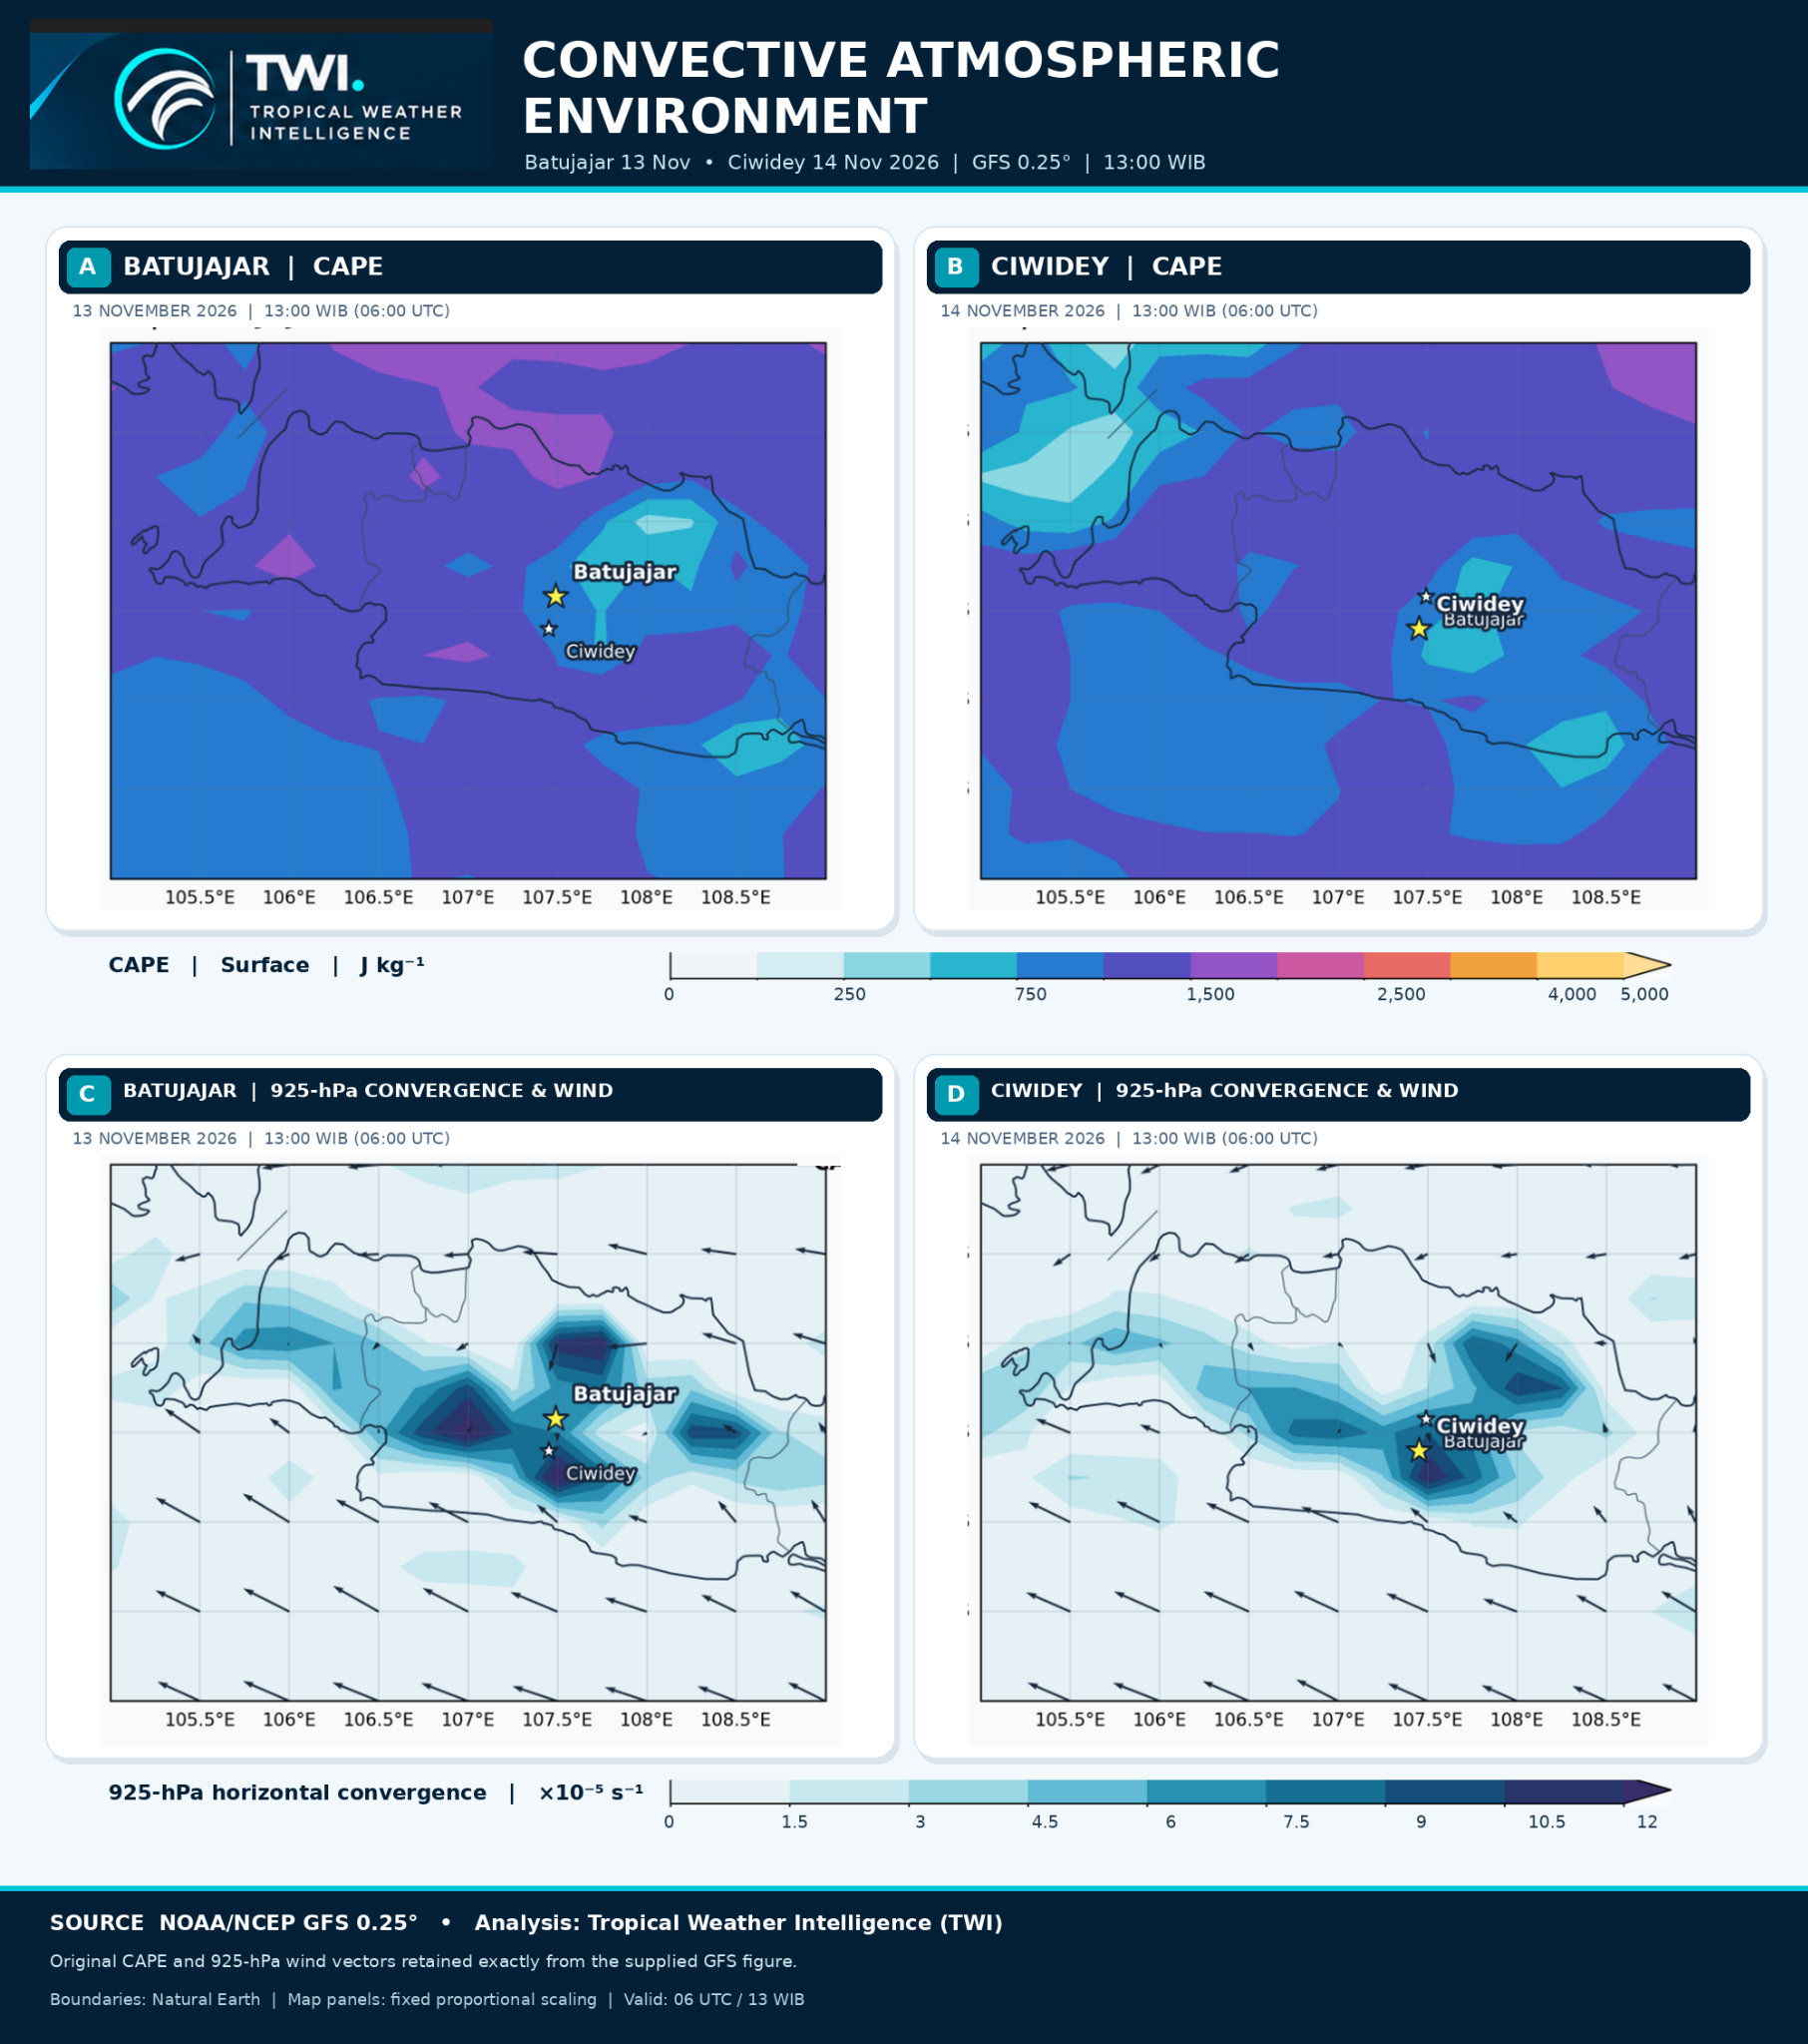
Figure 2. NOAA/NCEP GFS 0.25° analysis valid at 13:00 WIB (06:00 UTC) on 13 and 14 November 2026. Panels A–B: surface CAPE; panels C–D: positive horizontal convergence and winds at 925 hPa. Identical parameter colour scales are used across the two days. The map layout preserves the model-derived fields and vectors from the original figure. Boundaries: Natural Earth. Visualization: TWI.

GFS fields around the Bandung region contain CAPE broadly within approximately the 500–1,500 J kg⁻¹ colour classes, with spatial differences between and within the two dates. These are visual classes rather than point-specific values extracted at the damaged locations.

CAPE describes potential buoyant energy, not a direct measure of destructive winds. Thunderstorms may generate damaging gusts with moderate model-resolved CAPE if moisture, lifting, precipitation-driven downdrafts, vertical wind structure and storm organization are favourable.

At 0.25° resolution—roughly 27 km—GFS cannot resolve neighbourhood-scale temperature and humidity differences. Actual local instability may therefore be either higher or lower than the model value. It would be scientifically incorrect to multiply CAPE by an assumed correction factor.

3. Convergence, wind and complex terrain

The GFS 925-hPa fields show bands of enhanced horizontal convergence across western and central West Java on both days. Parts of the domain enter approximately the 9–12 × 10⁻⁵ s⁻¹ convergence classes, although these are regional maxima and not direct observations of individual storm boundaries.

Low-level convergence can support ascent and convective growth where moist and unstable air is present. In Batujajar, the convergence environment coincided with rapidly changing cloud organisation. In Ciwidey, the same broad lifting mechanism existed within an already extensive cold-cloud environment.

Terrain matters. The Bandung highlands are elevated and topographically complex. In places, notably near Ciwidey, the 925-hPa pressure surface can intersect or lie below local ground elevation. Model winds and convergence at that level require particular caution and must not be treated as literal measurements just above the surface.

Environmental wind vectors shown on Figure 2 are also not measurements of destructive surface gusts. Strong thunderstorm outflows can substantially exceed prevailing environmental winds through evaporation-driven negative buoyancy, downdraft acceleration and downward momentum transport. But there is no scientifically defensible fixed multiplier for converting 925-hPa GFS winds into maximum surface gusts. A measured wind speed cannot be assigned to either event from these figures alone.

4. What the two events tell us

Batujajar exhibited a comparatively concentrated cold-cloud development close to the damaging-wind period. Ciwidey occurred amid a broader, persistent deep-convective cloud shield. Both days show regional instability and convergence, but cloud extent does not directly indicate local gust intensity.

Nor do the present observations establish whether either event was a tornado, downburst or gust front. That distinction requires radar velocity, high-frequency surface observations and detailed, georeferenced damage surveys.

For severe-weather monitoring in West Java, the most robust approach combines satellite cloud evolution, model diagnostics, weather radar, surface observations and verified impact reports—particularly in populated mountainous terrain where convective conditions change rapidly.

Conclusion

The two destructive wind events highlight different convective cloud evolutions within atmospherically active environments. Himawari-9 shows rapid local cold-cloud development near Batujajar and more widespread persistent deep convection around the Ciwidey observation period. GFS identifies environmental instability and regional low-level convergence on both days.

Destructive convective winds are not determined by CAPE or cloud-top temperature alone. They emerge through interactions between moisture, instability, lifting, storm organisation, downdrafts and local terrain. Identifying the precise damaging-wind mechanism still requires storm-scale evidence.

Data and scientific sources

Provenance note. These local-authority figures were verified through contemporary public reporting; TWI has not independently obtained the original authority assessment documents.

Editorial note. Damage figures reflect local reports available during 13–14 November and may be revised. Temperature, CAPE and convergence ranges are approximate colour classes, not independently extracted local extrema. These scientific analyses are not official warnings.

TWI editorial cover highlighting the Batujajar and Ciwidey wind events
Sampul merupakan ilustrasi editorial; Figure 1 dan Figure 2 di bawah menampilkan analisis ilmiah berbasis data satelit dan model.
TWI · ANALISIS CUACA KONVEKTIF EKSTREM

Dua Hari, Dua Kejadian Angin Merusak: Apa yang Terjadi pada Atmosfer Konvektif Jawa Barat?

Batujajar · 13 November | Ciwidey · 14 November 2026

Dr. Deni Septiadi · Founder & Scientific Director, TWI · 14 November 2026

Dua sore, dua kejadian angin merusak

Angin merusak terjadi dua sore berturut-turut di kawasan Bandung pada 13–14 November 2026. Peristiwa ini menunjukkan pentingnya memahami perkembangan konveksi tropis yang cepat di Jawa Barat.

Pada Jumat, 13 November, hujan deras dan angin kencang melanda Batujajar, Kabupaten Bandung Barat, sekitar pukul 14.30 WIB. Pendataan setempat yang diperbarui melaporkan 197 rumah rusak: 82 rusak ringan, 75 sedang, dan 40 berat. Dua belas fasilitas umum dan SDN Hegarmanah juga terdampak. Laporan awal menyebut tiga orang mengalami luka.

Sehari kemudian, 14 November, angin merusak melanda Ciwidey dan Pasirjambu, Kabupaten Bandung. Di Pasar Cibeureum dilaporkan 25 toko dan bangunan rusak, dua di antaranya rusak berat. Kerusakan mencakup atap, kanopi, dan infrastruktur utilitas, serta laporan dampak tambahan di sekitar lokasi.

Kedua kejadian berjarak sekitar satu hari, tetapi harus diperlakukan sebagai dua episode konveksi berbeda, bukan dianggap berasal dari satu sistem badai yang sama. Tropical Weather Intelligence (TWI) membandingkan pengamatan Himawari-9 dengan analisis atmosfer NOAA/NCEP GFS.

Sumber data kerusakan. Angka sementara 197 rumah rusak di Batujajar berasal dari Pemerintah Kecamatan Batujajar. Angka 25 bangunan rusak di Ciwidey–Pasirjambu berasal dari Badan Penanggulangan Bencana Daerah (BPBD) Kabupaten Bandung. Angka tersebut merupakan hasil pendataan awal, dapat berubah, dan bukan hasil survei lapangan TWI sendiri.

1. Bukti satelit: dua pola pertumbuhan konveksi

Perbandingan suhu puncak awan Himawari-9 Batujajar dan Ciwidey
Figure 1. Enhanced infrared Himawari-9 AHI Band 13 (10,4 µm). Batujajar: 12.30, 13.30, dan 14.30 WIB tanggal 13 November; Ciwidey: 13.30, 14.30, dan 15.30 WIB tanggal 14 November 2026. Skala suhu sama pada seluruh panel. Tampilan editorial tidak menggantikan perhitungan numerik dari piksel asli. Sumber: JMA melalui NOAA Open Data; pengolahan ilmiah: TWI.

Di Batujajar, cakupan awan konvektif sangat dingin di sekitar lokasi masih relatif terbatas pada 12.30 WIB. Menjelang 14.30 WIB, muncul gugusan puncak awan sangat dingin yang lebih terkonsentrasi dekat titik referensi wilayah, berdekatan dengan waktu laporan angin merusak.

Di Ciwidey, bentangan awan sangat dingin sudah luas pada 13.30 WIB dan tetap menonjol hingga 14.30–15.30 WIB. Pada rangkaian citra terpilih, lingkungan konvektif tanggal 14 November terlihat lebih luas dan persisten.

Warna enhanced IR mencakup kelas suhu kecerahan sekitar −70°C hingga −80°C, yang konsisten dengan puncak awan sangat tinggi dan dingin dalam konveksi tropis. Suhu tersebut tidak langsung mengukur intensitas hujan, kecepatan arus naik, atau hembusan angin di permukaan. Nilai minimum tepat dan luas awan di bawah −70°C dalam km² belum dapat ditetapkan hanya dari gambar; perlu penghitungan piksel satelit terkalibrasi dan tergeolokasi.

2. CAPE: bukan satu-satunya penentu angin merusak

Analisis CAPE, konvergensi 925 hPa dan angin GFS di Batujajar dan Ciwidey
Figure 2. Analisis GFS 0,25° valid pukul 13.00 WIB (06.00 UTC) pada 13 dan 14 November 2026. Panel A–B: CAPE permukaan; panel C–D: konvergensi horizontal positif dan angin 925 hPa. Kedua tanggal menggunakan skala parameter yang sama. Medan angin dan kontur dipertahankan dari figure GFS asli. Batas wilayah: Natural Earth. Visualisasi: TWI.

Medan CAPE GFS di kawasan Bandung secara umum menunjukkan kelas warna sekitar 500–1.500 J kg⁻¹, dengan variasi spasial. Rentang tersebut berasal dari pembacaan legenda gambar, bukan ekstraksi nilai tepat di bangunan yang terdampak.

CAPE menunjukkan energi apung yang mungkin tersedia bagi konveksi, bukan besarnya angin merusak. Hembusan kuat tetap mungkin terjadi ketika kelembapan, mekanisme pengangkatan, struktur angin vertikal, organisasi badai, serta proses arus turun mendukungnya.

Resolusi GFS 0,25°, sekitar 27 km, tidak dapat menangkap semua perbedaan suhu dan kelembapan pada skala permukiman. Instabilitas lokal bisa lebih tinggi ataupun lebih rendah daripada nilai model. Tidak ada dasar ilmiah untuk otomatis mengalikan angka CAPE dengan faktor koreksi.

3. Konvergensi, angin, dan pengaruh topografi

Medan angin GFS 925 hPa mengindikasikan pita konvergensi horizontal di sebagian Jawa Barat pada kedua tanggal. Beberapa kawasan masuk kelas warna sekitar 9–12 × 10⁻⁵ s⁻¹, tetapi itu merupakan maksimum regional model, bukan pengukuran batas konveksi tepat di lokasi kerusakan.

Konvergensi udara lembap pada lapisan bawah dapat mendukung pengangkatan udara dan pertumbuhan awan. Di Batujajar, lingkungan ini bertepatan dengan perubahan pesat organisasi awan dingin. Di Ciwidey, mekanisme pengangkatan regional berlangsung saat awan konvektif sudah meluas.

Topografi Bandung perlu diperhatikan. Kawasan Ciwidey berada pada dataran tinggi yang sebagian dapat lebih tinggi daripada permukaan tekanan 925 hPa. Angin dan konvergensi model pada lapisan tersebut bisa berupa hasil interpolasi atau ekstrapolasi model di dekat atau di bawah permukaan tanah; karena itu tidak boleh disamakan dengan pengukuran angin nyata dekat permukaan.

Vektor angin pada Figure 2 juga bukan nilai hembusan maksimum di permukaan. Hembusan badai dapat jauh melampaui angin lingkungan melalui pendinginan evaporatif, percepatan arus turun, dan pengangkutan momentum dari lapisan atas. Namun, tidak tersedia faktor pengali tetap yang dapat mengubah angin GFS 925 hPa menjadi kecepatan gust maksimum. Kedua kejadian belum memiliki nilai gust terverifikasi dalam figure ini.

4. Apa makna perbedaan kedua kejadian?

Batujajar memperlihatkan perkembangan awan dingin yang lebih terkonsentrasi mendekati waktu kejadian. Ciwidey memperlihatkan tutupan awan konvektif dalam yang lebih luas dan bertahan. Kedua hari memiliki instabilitas dan konvergensi regional, tetapi luas awan tidak dapat dijadikan ukuran langsung kekuatan angin lokal.

Bukti yang ada juga belum dapat membedakan apakah mekanisme angin merusak berupa tornado, downburst, atau gust front. Diperlukan pengukuran angin permukaan berfrekuensi tinggi, radar kecepatan radial, dan survei kerusakan yang tergeolokasi.

Untuk pemantauan cuaca ekstrem di daerah pegunungan padat penduduk, pendekatan paling kuat adalah menggabungkan citra satelit, diagnostik model, radar cuaca, observasi permukaan, dan laporan dampak yang telah diverifikasi.

Kesimpulan

Dua kejadian angin merusak di Bandung terjadi pada kondisi atmosfer yang aktif, dengan pola perkembangan konvektif yang berbeda. Himawari-9 memperlihatkan pertumbuhan awan sangat dingin yang relatif cepat di Batujajar, sedangkan Ciwidey berada dalam lingkungan konveksi dalam yang lebih luas dan persisten. Analisis GFS memperlihatkan instabilitas serta konvergensi regional pada kedua hari.

Angin konvektif merusak tidak ditentukan CAPE atau suhu puncak awan semata. Dampaknya melibatkan interaksi kelembapan, instabilitas, pengangkatan, organisasi awan badai, arus turun, dan kondisi topografi. Penetapan mekanisme spesifik tetap memerlukan bukti pada skala badai.

Data dan sumber ilmiah

Catatan penelusuran sumber. Angka yang diatribusikan kepada pemerintah daerah tersebut telah diperiksa melalui pemberitaan publik pada waktu kejadian; TWI belum memperoleh dokumen asesmen asli langsung dari instansi terkait.

Catatan editorial. Angka kerusakan bersumber dari laporan lokal tanggal 13–14 November dan mungkin diperbarui. Suhu, CAPE, dan konvergensi yang disebutkan merupakan kisaran kelas warna, bukan maksimum lokal hasil ekstraksi numerik. Analisis TWI bukan peringatan dini resmi.